什麼是 Kinaba ?
Kinana 簡單的說就是一個視覺化工具,但其中還新增了許多與 Elasticsearch 進行設定的功能,來方便我們對 ES 進行操作。
出來吧 ! Kibana
話說在上一章節,我們已經將 Filebeat、ES、Logstash 啟動完畢,ES 中也開始存儲資料了,接下來就讓我們從 Kibana 上進行展示。
Edit yaml configuration
## kibana.yml
server.host: "0.0.0.0"
server.port: "5601"
server.name: "kibana"
elasticsearch.hosts: ["http://192.168.144.5:9200/"]
xpack:
  apm.ui.enabled: false
  graph.enabled: false
  ml.enabled: false
  monitoring.enabled: false
  reporting.enabled: false
  security.enabled: false
  grokdebugger.enabled: false
  searchprofiler.enabled: false
Run kibana
docker run -d \
-p 5601:5601 \
-v $PWD/kibana.yml:/usr/share/kibana/config/kibana.yml:ro \
kibana:7.17.9
Find indices
接下來我們連接到 http://localohsot:5601 嘗試尋找我們的 traefik-log 位置。
- 第一次進入 Kibana 時會出現 Start by adding integrations 建議,這邊我們選擇 Explore on my own。
- 點選左上角的側拉選單,從選單中選擇 Stack management。
- 進入 Management 後,我們選擇 Index Management。
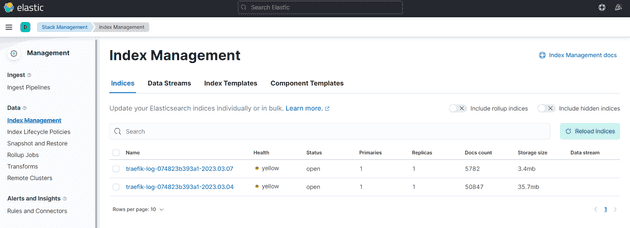
- 檢視是否有 traefik 相關 index,理論上我們會看到如檢核點中的畫面。
檢核點
Create index patterns
我們已經確定有資料了,接下來就是要建立 Index Pattern 方便讓 Kibana 進行使用。
- 讓我們再度回到 Stack Management 中。
- 選擇 Index Pattern,並且 Create index pattern。
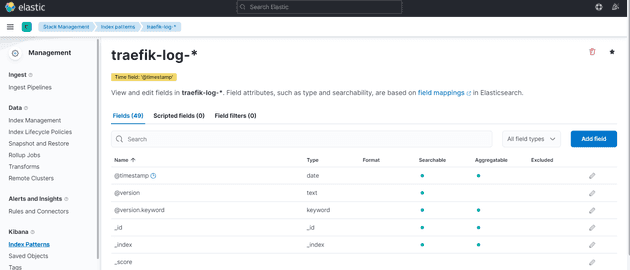
- Name 輸入 traefik-log-*,這個 Pattern 就可以索取 Prefix 為 traefik-log 的 Index。
- Timestamp field 選擇 @timestamp。
- 點選 Create index pattern。
檢核點
Create dashboard
到最後,我們可以開始建立簡單的圖表資訊了,讓我們利用這個 index pattern 來建立吧 !
- 點擊左上角的側拉選單,從選單中選擇 Dashboard。
- 點擊 Create new dashboard 並且進入畫面。
- 點擊左方的 Create visualization。
- 使用以下表格輸入相關參數。
| 項目 | 內容 |
|---|---|
| Index pattern | traefik-log-* |
| Layer visualization type | Area |
| Horizontal axis | @timestamp |
| Vertical axis | Select "Count" function |
| Vertical axis | Select "Record" field |
- 點擊右上方的 Save and return。
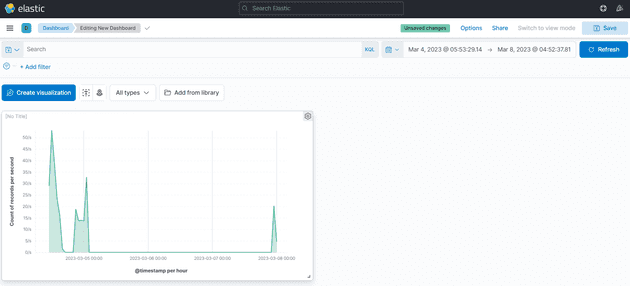
- 我們可以檢視到 traefik 的流量統計圖了。
檢核點
結論
終於到了終章,在此次的系列文章中,我們非常簡易的跑過一次 ELK 相關流程,在這邊還是得叮嚀一下,記得要因應需求來進行變更,我們此次文章僅僅是 Demo 型態。


